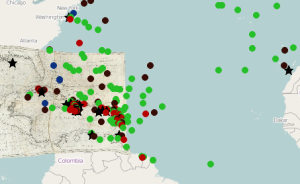
Here is a very cool combination of early modern historical data and very modern technology. ShipIndex exhibited at the American Historical Association conference in New York City at the very start of 2015, and while there I met Abby Mullen, a graduate student at Northeastern University, studying with William Fowler.
At the conference, I learned that Ms. Mullen has an interest in maritime & naval history, as any right-minded person should, but after the conference I learned she’s done some really cool work in tracking naval battles and the taking of ships by privateers during the Quasi-War of 1798-1800. She took all of the information she’d gathered, and mapped all of it, then put it all online at http://abbymullen.org/projects/Quasi-War/.
As she explains in her description of this image, “This screenshot shows most of the encounters between American and French vessels. Green is a French capture; red is an American; brown is an encounter that did not result in a capture either way.” Note the grey almost-rectangle in the left-center. That’s a separate chart, from the late 18th century, which she has adapted and stretched to reflect our improved geographic knowledge of the region.
Plus, she wrote up how she collected the data, she posted the data on her page, and talked about the challenges of converting historical data — especially the historical map/chart she chose to plot the data upon — to a modern format and with modern specificity. She also highlighted the limitations of the data she collected, and described other activities she’d like to see done, if possible.
This is a great application of historical data in a modern setting. Check it out!

